
About Dashboards
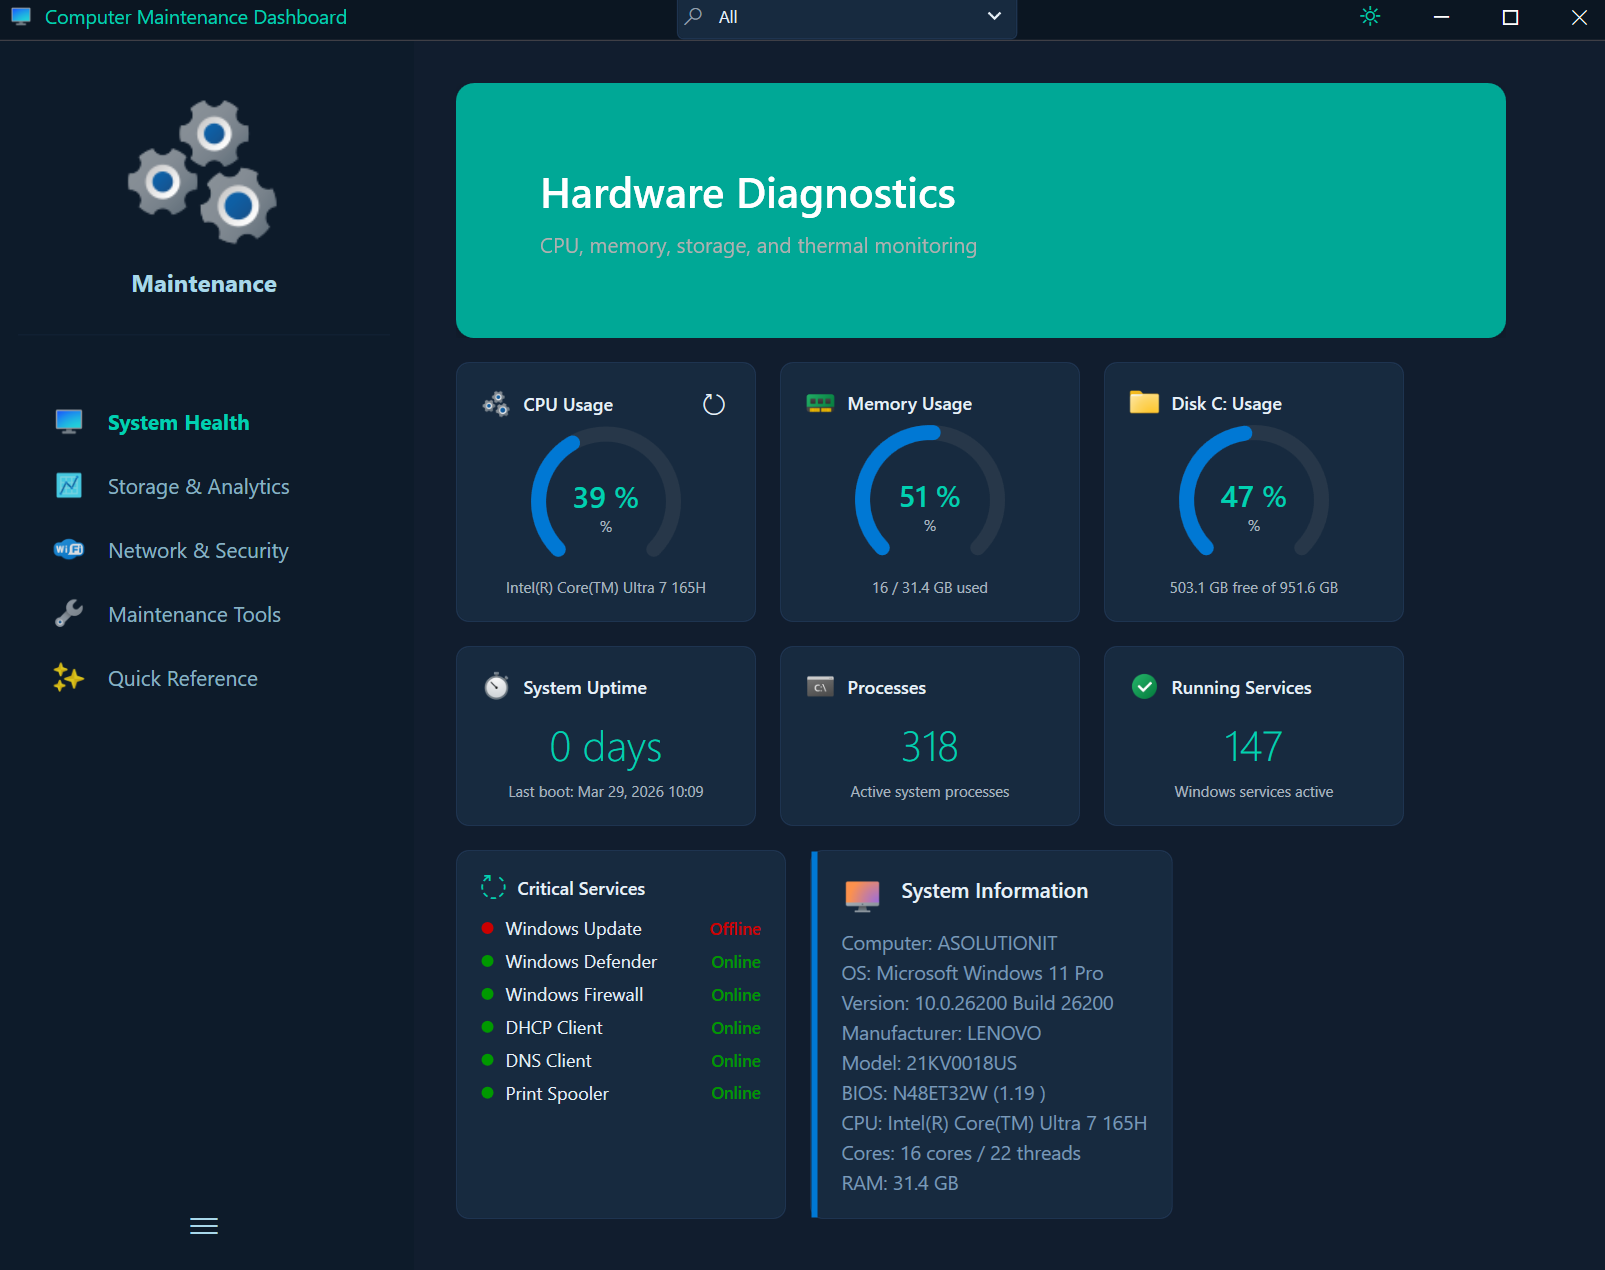
Dashboards in PoshUI are designed for real-time monitoring, KPI visualization, and IT operations management. They provide a high-level overview of system health and metrics using a card-based grid layout.
Key Features
- Card-Based Layout: Organized grid of information cards that can be categorized and filtered.
- Rich Visualizations: Built-in support for metric KPIs, charts (Bar, Line, Area, Pie), and data grids.
- Live Refresh: Cards can execute PowerShell scripts on a schedule to update their values automatically.
- Category Filtering: Built-in search and filtering to group related cards together.
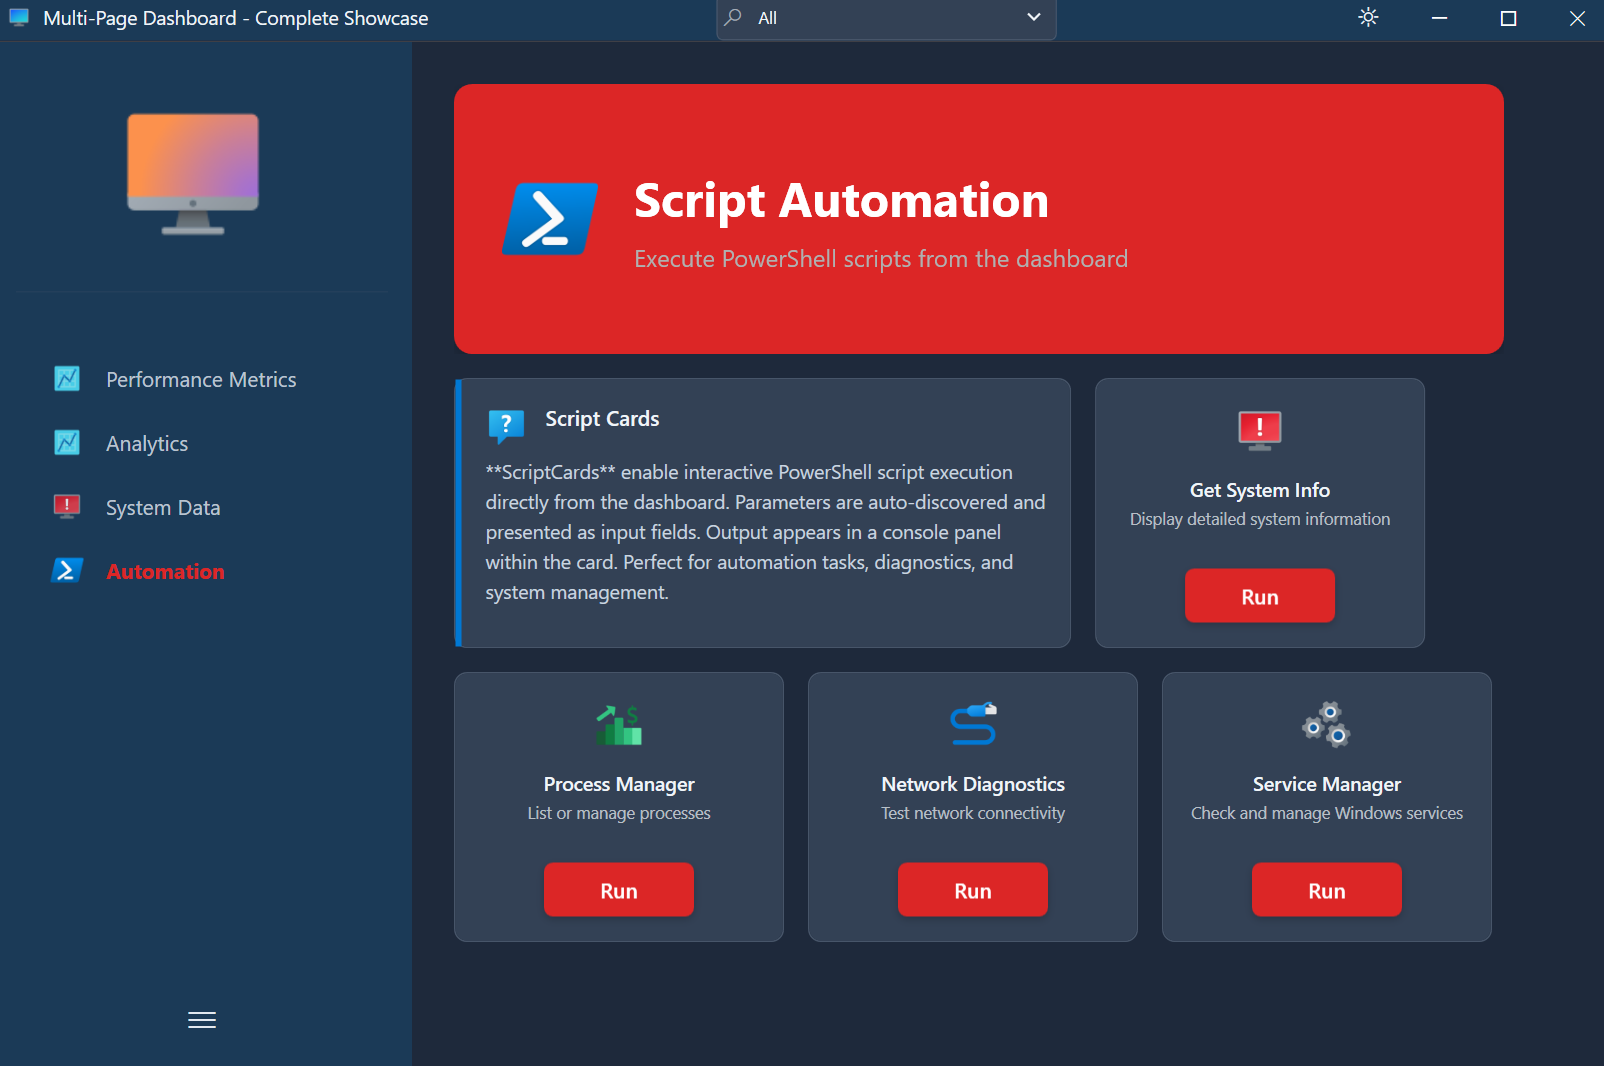
- Interactive Tools: ScriptCards allow users to run management tasks directly from the dashboard.
- Export Capabilities: Export data from DataGridCards to CSV or TXT files.
- PNG Icon Support (v1.3.0): Full-color PNG icons on steps, cards, banners, and carousel slides.
- Carousel Banners with PNG Icons (v1.3.0): Per-slide PNG icons in clickable carousel banners.
- Dual-Mode Custom Themes (v1.3.0): Independent light/dark color palettes with runtime toggle.
- Theme Toggle (v1.3.0): Sun/moon button in the title bar for instant theme switching.
When to Use Dashboards
Dashboards are ideal for:
- System Monitoring: Tracking CPU, memory, disk space, and service status across servers.
- Deployment Tracking: Monitoring the progress of automated deployments.
- Incident Management: Displaying active tickets or alerts from monitoring systems.
- Executive KPI Displays: High-level summaries of infrastructure health.
Workflow
A PoshUI Dashboard follows this pattern:
- Initialize: Use
New-PoshUIDashboardto start a new definition. - Define Pages: Add dashboard pages using
Add-UIStep -Type Dashboard. - Add Components: Populate pages with
Add-UIMetricCard,Add-UIChartCard,Add-UITableCard,Add-UIStatusCard,Add-UIScriptCard,Add-UICardorAdd-UIBanner. - Show: Display the interface using
Show-PoshUIDashboard.
Next: Creating Dashboards