
GraphCard
Dashboard Module Only
GraphCards are only available in the PoshUI.Dashboard module. They cannot be used in Wizards or Workflows.
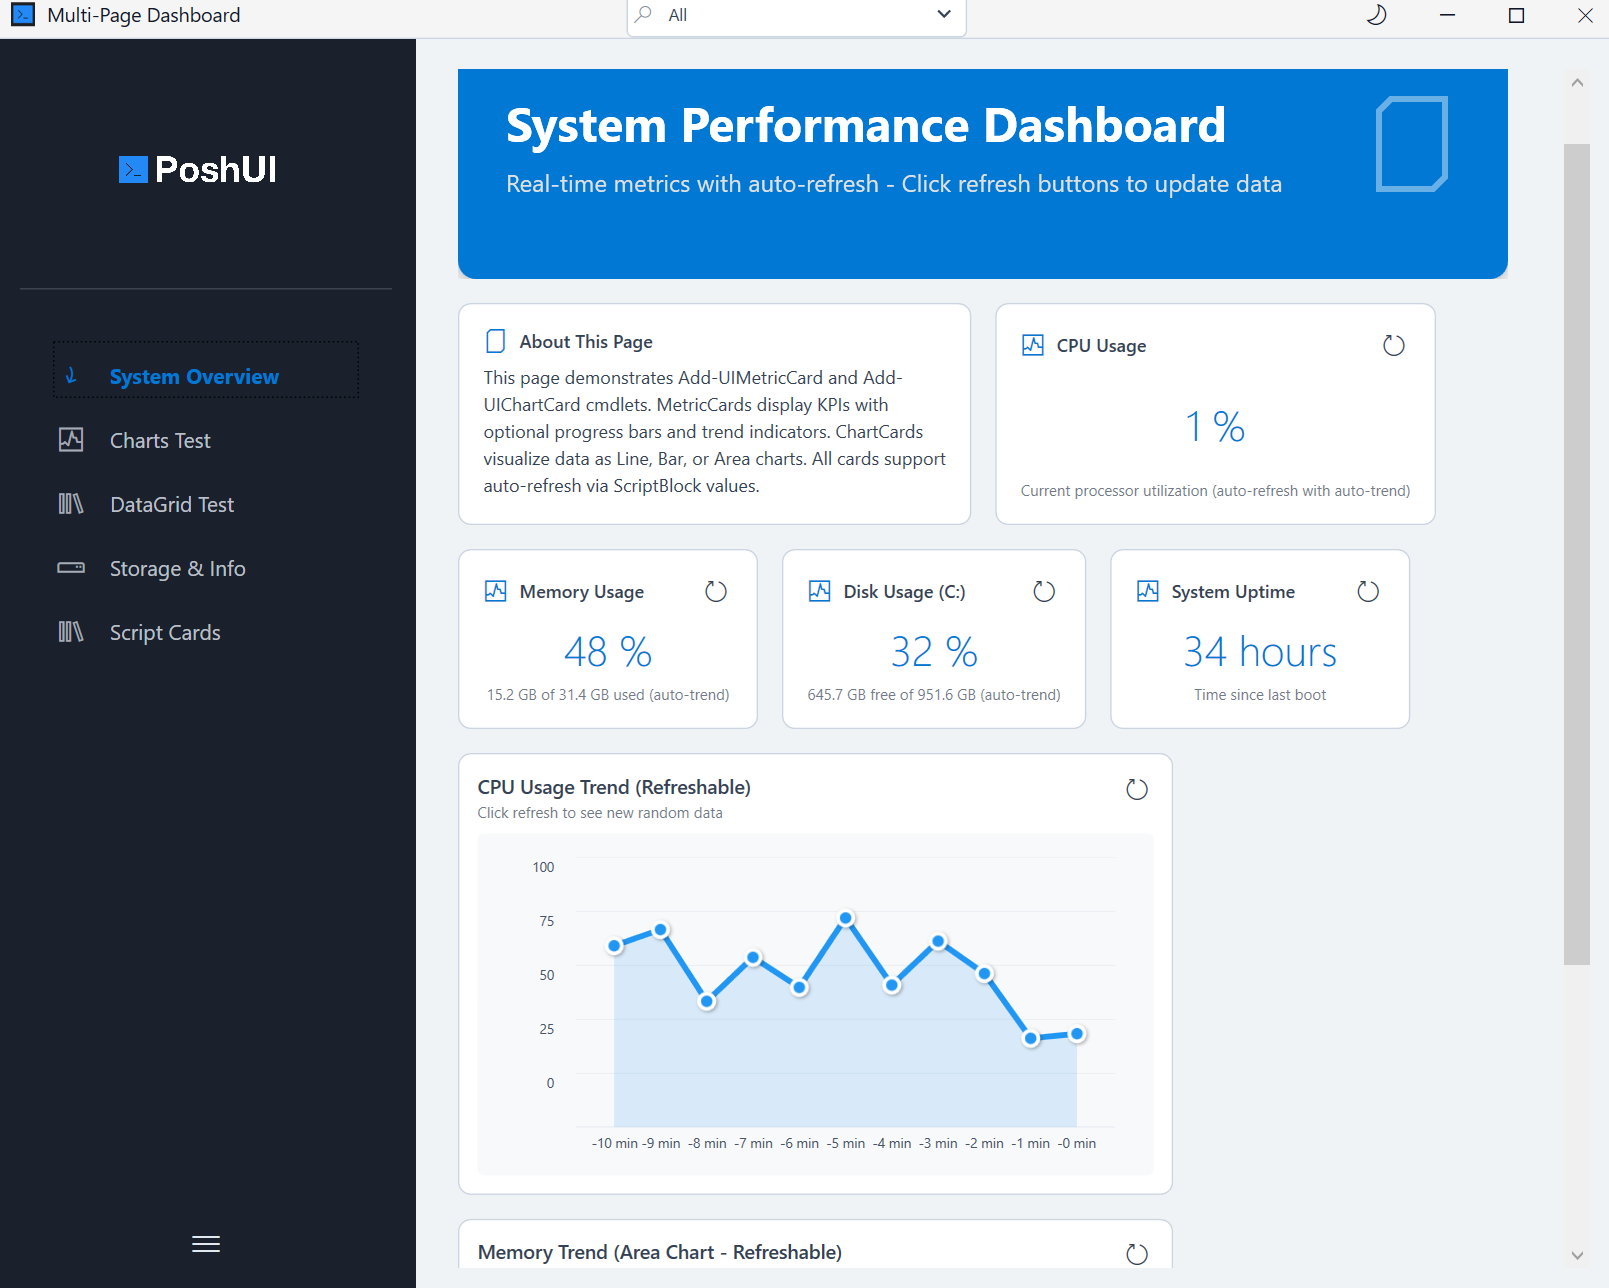
The GraphCard provides interactive charts for visualizing trends and distributions directly on your dashboard.
Basic Usage
powershell
$chartData = @(
    @{ Label = 'Jan'; Value = 100 }
    @{ Label = 'Feb'; Value = 150 }
    @{ Label = 'Mar'; Value = 120 }
)

Add-UIChartCard -Step 'Overview' -Name 'SalesChart' `
    -Title 'Monthly Sales' -ChartType 'Bar' -Data $chartData
Supported Chart Types
-ChartType accepts five values:
- Bar: Best for comparing distinct categories.
- Line: Ideal for showing trends over time.
- Area: Similar to line charts but highlights the volume under the line.
- Pie: Best for showing proportional distributions (percentage of a whole).
- Donut: A pie with the centre cut out - the same data, more room for a legend.
Data Format
The -Data parameter accepts an array of hashtables. Each hashtable should contain a Label (string) and a Value (numeric).
powershell
$data = @(
    @{ Label = 'Available'; Value = 45 }
    @{ Label = 'Used'; Value = 55 }
)
Add-UIChartCard -Step 'Overview' -Name 'Storage' `
    -Title 'Storage Distribution' -ChartType 'Pie' -Data $data
Key Parameters
| Parameter | Type | Description |
|---|---|---|
-ChartType | String | 'Line', 'Bar', 'Area', 'Pie' or 'Donut'. |
-Data | Array | An array of hashtables containing Label and Value. |
-ShowLegend | Boolean | Whether to display the chart legend (default: $true). |
-ShowTooltip | Boolean | Whether to show values when hovering over data points (default: $true). |
Live Refresh
A chart with a -RefreshScript can be re-run from the card itself, or by the dashboard's Refresh all - see Card Refresh.
powershell
Add-UIChartCard -Step 'Overview' -Name 'LiveNet' `
    -Title 'Network Traffic' -ChartType 'Area' -Data @() `
    -RefreshScript {
        # Fetch latest traffic stats and return as chart data
        Get-NetworkStats | Select-Object @{N='Label';E={$_.Time}}, @{N='Value';E={$_.Bytes}}
    }
Next: DataGridCard